
-
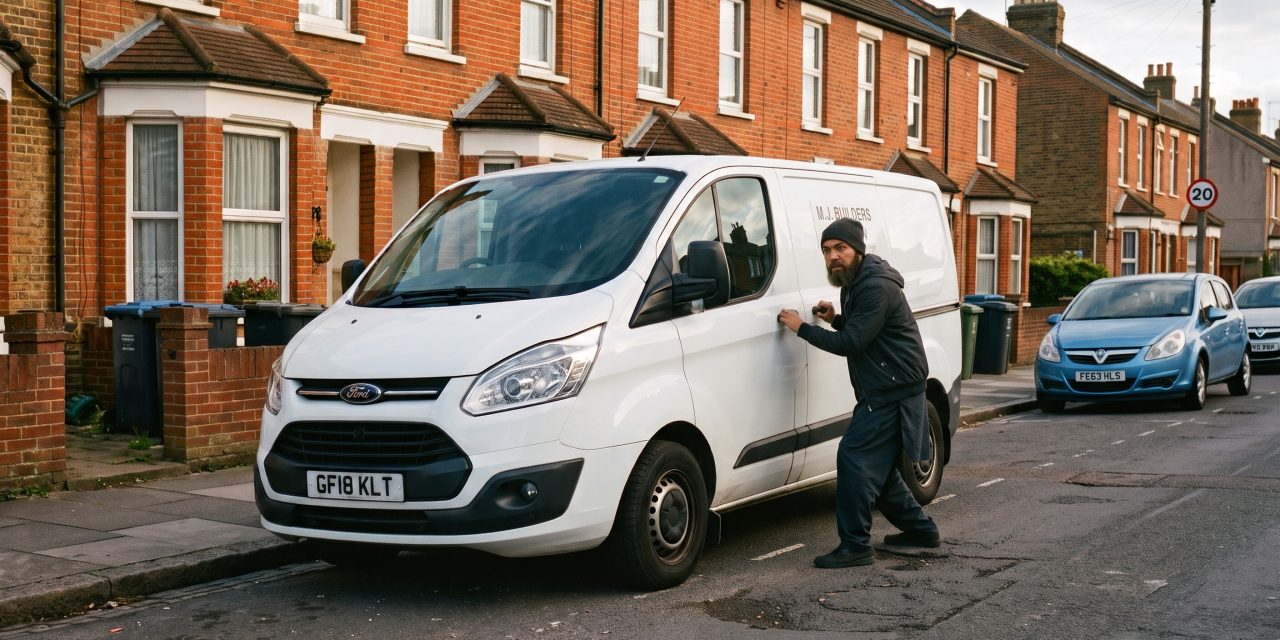
New research reveals that a van was stolen every 52 minutes in the UK in 2025.
-
Ford vans accounted for the most thefts across 2024 and 2025, with over 11,700 incidents recorded.
-
The Ford Transit 350 topped the list, with 1,309 stolen during this period.
-
White vans are the most targeted by thieves, accounting for over 16,000 thefts – around 73% of all van thefts.
Van thefts across the UK fell by 16% from 2024 to 2025, with the frequency of incidents slowing from one every 44 minutes in 2024 to every 52 minutes in 2025, according to the latest DVLA data obtained via a Freedom of Information request.
Despite the overall downward trend, high-demand commercial models, essential for tradespeople, remain a primary target for theft based on new analysis by Tempcover, experts in temporary van insurance.
Ford Vans Dominate UK Van Theft Figures
Ford accounted for the highest volume of thefts during the two-year period of 2024 and 2025, with over 11,700 thefts recorded. This represents 53% of all recorded van thefts – almost four times the total of the second most targeted make, Mercedes-Benz (2,935).
However, this volume likely reflects Ford’s strong market presence. With 31,936 new registrations in 2025 (38% market share)[1], the prevalence of Ford vans in theft data is indicative of the high volume on UK roads and subsequent exposure to risk.
|
Rank |
Make |
Vans Stolen 2024 |
Vans Stolen 2025 |
% Change 24-25 |
Total Vans Stolen (24&25) |
|
1 |
Ford |
6,338 |
5,371 |
-15.26% |
11,709 |
|
2 |
Mercedes-Benz |
1,741 |
1,194 |
-31.42% |
2,935 |
|
3 |
Peugeot |
876 |
709 |
-19.06% |
1,585 |
|
4 |
Vauxhall |
774 |
738 |
-4.65% |
1,512 |
|
5 |
Citroen |
753 |
670 |
-11.02% |
1,423 |
|
6 |
Volkswagen |
534 |
474 |
-11.24% |
1,008 |
|
7 |
Renault |
400 |
363 |
-9.25% |
763 |
|
8 |
Fiat |
213 |
200 |
-6.10% |
413 |
|
9 |
Nissan |
86 |
62 |
-27.91% |
148 |
|
10 |
Iveco |
73 |
53 |
-27.40% |
126 |
Ford Transits Most Targeted by Thieves
The Ford Transit 350 was the UK’s most stolen van model, with 1,309 incidents in 2024 and 2025 combined, accounting for around 6% of all van thefts over the period. Ford Transit variants feature heavily across the top ten most stolen models, alongside the Mercedes Sprinter.
Across the two years, the Ford Transit Custom 300 Base had the largest theft increase among the top 10 models, rising 60.87%. In comparison, the Ford Transit 100 T280 FWD saw the largest fall (-46.50%).
Outside the top 10, among vans with over 100 thefts over the same period, the Ford Transit Custom 300 Trend saw the largest increase, rising from 49 thefts in 2024 to 116 in 2025 (136.73%).
|
Rank |
Make |
Model |
Vans Stolen 2024 |
Vans Stolen 2025 |
% Change 24-25 |
Total Vans Stolen (24&25) |
|
1 |
Ford |
Transit 350 |
677 |
632 |
-6.65% |
1,309 |
|
2 |
Mercedes-Benz |
Sprinter 313 CDI |
613 |
378 |
-38.34% |
991 |
|
3 |
Mercedes-Benz |
Sprinter 314 CDI |
579 |
383 |
-33.85% |
962 |
|
4 |
Ford |
Transit Custom 290 Eco-Tech |
332 |
245 |
-26.20% |
577 |
|
5 |
Ford |
Transit 350 Leader Ecoblue |
216 |
278 |
28.70% |
494 |
|
6 |
Ford |
Transit Custom 270 Eco-Tech |
204 |
172 |
-15.69% |
376 |
|
7 |
Ford |
Transit Custom 300 Base |
138 |
222 |
60.87% |
360 |
|
8 |
Ford |
Transit 125 T350 RWD |
202 |
120 |
-40.59% |
322 |
|
9 |
Ford |
Transit Custom 300 Leader Eblue |
169 |
147 |
-13.02% |
316 |
|
10 |
Ford |
Transit 100 T280 FWD |
200 |
107 |
-46.50% |
307 |
White Vans Top Theft List And Are Disproportionately Targeted
The data highlights a significant disparity in vehicle colour, with white vans accounting for 73% of all thefts in the last two years. Across 2024 and 2025, 16,121 white vans were stolen – more than seven times higher than the next most frequent target, silver (2,140). Grey (1,286), blue (920), and black (818) vans follow, but at significantly lower levels.
While white is the most common van colour, representing more than half of all vans in 2024, the theft rate of 73% suggests these vehicles are being targeted at a rate that exceeds their market share[2].
Van Thefts Vary by Region
The data also reveals that van thefts are not evenly spread across the UK, with certain areas seeing significantly higher volumes, although this is largely influenced by population size and vehicle density. The (B) Birmingham postcode area recorded the highest volume over the last two years (1,446), followed by (S) Sheffield (695), and (GU) Guildford (577).
|
Rank |
Vehicle Keeper’s Postcode |
Vans Stolen 2024 |
Vans Stolen 2025 |
% Change 24-25 |
Total Vans Stolen (24&25) |
|
1 |
B (Birmingham) |
797 |
649 |
-18.57% |
1,446 |
|
2 |
S (Sheffield) |
384 |
311 |
-19.01% |
695 |
|
3 |
GU (Guildford) |
341 |
236 |
-30.79% |
577 |
|
4 |
BS (Bristol) |
287 |
270 |
-5.92% |
557 |
|
5 |
WS (Walsall) |
276 |
219 |
-20.65% |
495 |
|
6 |
LS (Leeds) |
258 |
222 |
-13.95% |
480 |
|
7 |
SL (Slough) |
269 |
193 |
-28.25% |
462 |
|
8 |
M (Manchester) |
241 |
170 |
-29.46% |
411 |
|
9 |
NG (Nottingham) |
217 |
167 |
-23.04% |
384 |
|
10 |
WV (Wolverhampton) |
204 |
171 |
-16.18% |
375 |
The Danger Months: Van Theft Spikes
While overall thefts fell from 11,962 in 2024 to 10,013 in 2025, monthly trends reveal specific peaks throughout the year. In 2024, thefts peaked in January (1,276), followed by March (1,087) and April (1,067). In 2025, the highest levels were recorded in October (912), November (876), and July (871).
Despite the 16% year-on-year decline, van theft remains a persistent issue – a trend that underlines both the progress made and the ongoing risk to van owners and tradespeople.